
To Author's Page
After publishing my blog post Machine Learning, Modern Data Analytics and Artificial Intelligence – What’s new? in October 2017, a user named Franco posted the following comment:
“Good article. In our experience though (finance), Deep Learning (DL) has a limited impact. With a few exceptions such as trading/language/money laundering, the datasets are too small and DL does not catch the important features. For example, a traditional Random Forest (RF) classification algorithm can be beat DL in financial compliance by a huge margin (e.g. >10 points in accuracy and recall). Additionally, RF can be made “interpretable” which is infinitely useful for the upcoming EU Regulation General Data Protection Regulation.”
I would like to take this comment as an impetus for this blog post. Neural Networks and especially Deep Learning are actually very popular and successful in many areas. However, my experience is that Random Forests are not generally inferior to Neural Networks. On the contrary, in my practical projects and applications, Random Forests often outperform Neural Networks.
This leads to two questions:
Let’s begin with a short description of both approaches. Both can be used for classification and regression purposes. While classification is used when the target to classify is of categorical type, like creditworthy (yes/no) or customer type (e.g. impulsive, discount, loyal), the target for regression problems is of numerical type, like an S&P500 forecast or a prediction of the quantity of sales.
Neural Networks represent a universal calculation mechanism based on pattern recognition. The idea is to combine simple units to solve complex problems. These units, also called neurons, are usually organized into several layers that have specific roles. The basic architecture of a so-called multi-layer perceptron is shown in Figure 1.
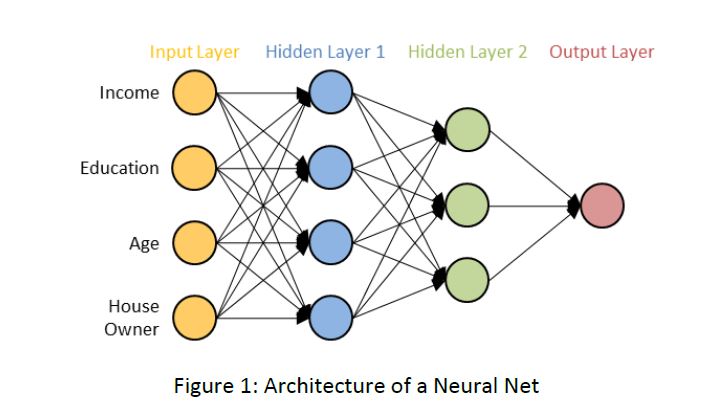
Figure 1: Architecture of a Neural Net
The Neural Network consists of an input and an output layer and in most cases one or more hidden layers that have the task to transform the inputs into something that the output layer can use. Neural Networks can process all kinds of data which is coded in numeric form. The data is inserted into the network via the input layer, transformed via the hidden layer(s) and finally scaled to the wanted outcome in the output layer. In the case of an assessment of creditworthiness, the input neurons would, for example, take values for income, education, age and house ownership. The output neuron would then provide the probability for creditworthiness.
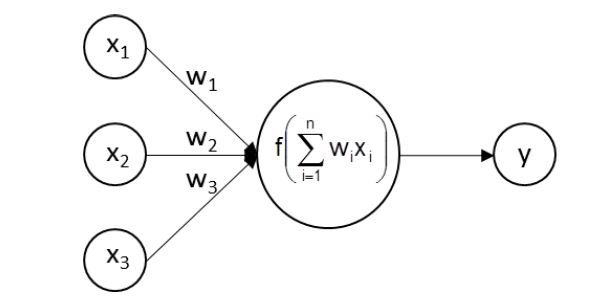
Figure 2: Functioning of a neuron
If we zoom into a hidden or output node, we see what is shown in figure 2. The node receives the outputs xi of the previous nodes to which it is connected. These are multiplied by weights wi and summed up. The sum is then transformed with a function f() and passed on to the nodes of the next layer or output as a result. After setting the architecture of a Neural Network (number of layers, number of neurons per layer and transformation function f() per neuron) the network is trained by searching for the weights that produce the desired output. Learning algorithms adjust the connection weights between the neurons according to minimize the (squared) differences between the real values of the target variables and those calculated by the network.
Thus, a Neural Network is a chain of trainable, numerical transformations that are applied to a set of input data and yield certain output data. With this very general paradigm we can build nearly anything: Image classification systems, speech recognition engines, trading systems, fraud detection systems, and so on.
A Neural Network can be made deeper by increasing the number of hidden layers. The more layers the more complex the representation of an application area can be. Deep Networks have thousands to a few million neurons and millions of connections.
Over time different variants of Neural Networks have been developed for specific application areas. Specifically for image processing, Convolutional Neural Networks were developed. Recurrent Neural Networks are designed to recognize patterns in sequences of data and Long Short-Term Memory Networks as a further development to learn long-term dependencies.
Random Forests belong to the family of decision tree algorithms. A Decision Tree represents a classification or regression model in a tree structure. Each node in the tree represents a feature from the input space, each branch a decision and each leaf at the end of a branch the corresponding output value (see figure 3).
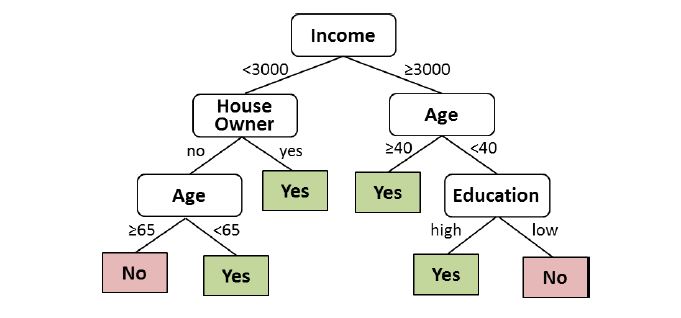
Figure 3: Architecture of a Decision Tree
To obtain a result for a specific input object, e.g. a person who applies for a credit, the decision process starts from the root node and walks through the tree until a leaf is reached which contains the result. At each node, the path to be followed depends on the value of the feature for the specific input object. In figure 3 for example the process walks to the left, if the person has an income lower than 3000.
Similar to Neural Networks, the tree is built via a learning process using training data. The learning process creates the tree step by step according to the importance of the input features in the context of the specific application. Using all training data objects, at first the most important feature is identified by comparing all of the features using a statistical measure. According to the resulting splitting value (3000 for income in figure 3), the training data is subdivided. For every resulting subset the second most important feature is identified and a new split is created. The chosen features can be different for every subset (see left and right branch in figure 3). The process is now repeated on each resulting subset until the leaf nodes in all the branches of the tree are found.
Frankfurt School gGmbH
Adickesallee 32-34
60322 Frankfurt am Main